You can try ceph-dash in a few seconds! It requires no api (since it brings it's own), just Python2, Flask and the Ceph Python bindins. And for sure a running Ceph cluster. No admin user required.
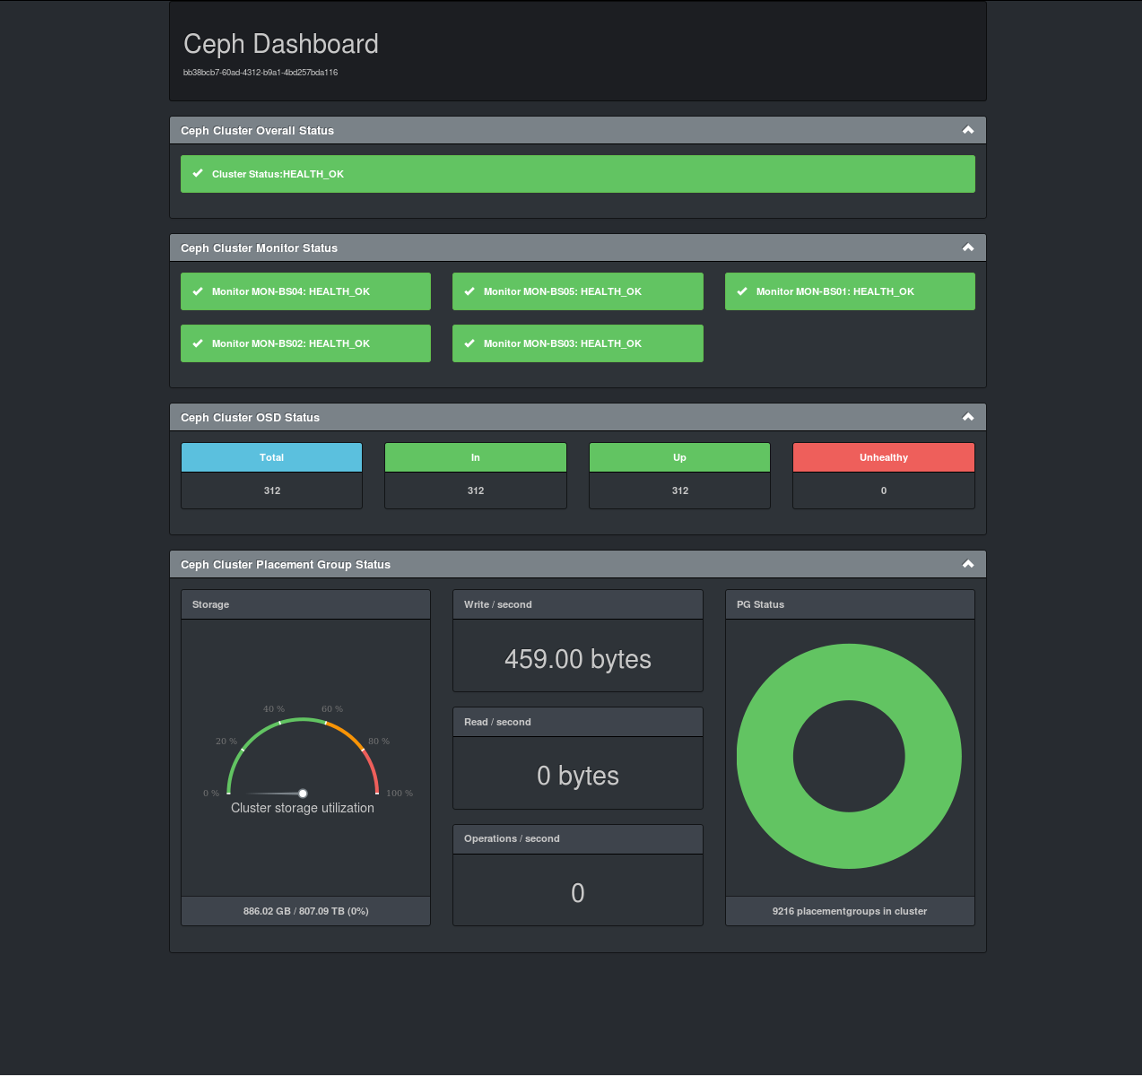
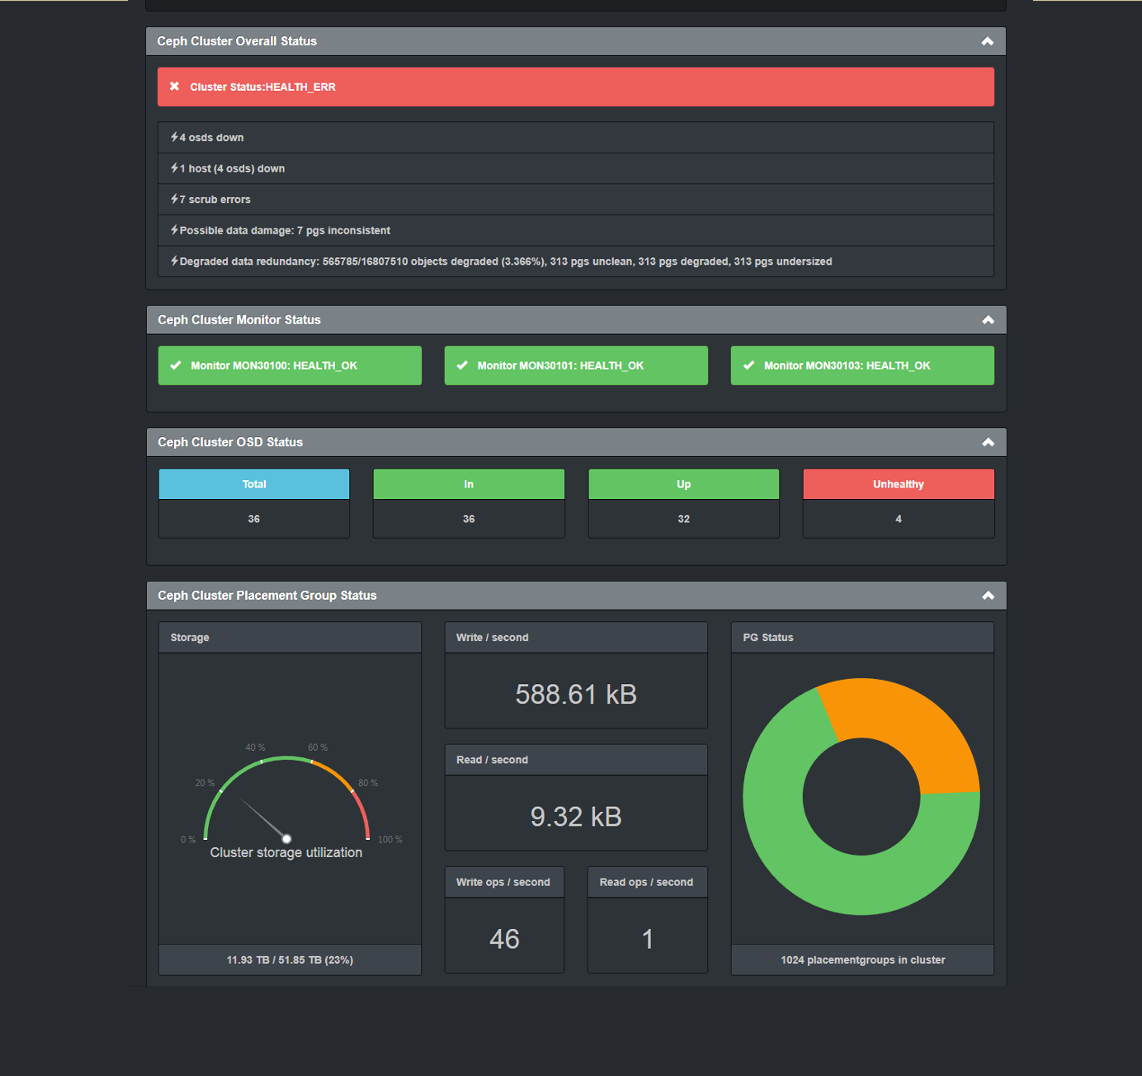
Ceph-dash shows you exactly what you need to know on a single web page! You can see at the first glance if something is wrong, and it will show you at the second glance WHAT and WHERE the problem is!
Ceph-dash is a small piece of software and written in (hopefully) easily understandable code. I already received lots of contributions and have also seen some forks with custom feature that suit special environments!
Ceph-dash is designed to show you everything you need to know about your ceph cluster health status on one clean page. Is there some recovery going on? Is my cluster in a warning state and if yes why? How many placement groups are in a unclean state? How much traffic is on my cluster right now? You will get all of the information by one quick look on your dashboard!
Ceph-dash only needs Python2 installed together with python-flask and python-ceph. It uses librados directly to talk with the ceph cluster and is not dependant on any other api. Just fire up ./ceph-dash.py and you have everything you need to monitor your ceph cluster. You don’t even need an admin user, read only access it enough.
You can use ceph-dash not only as a dashboard, you can also get all the cluster status information as JSON data, calling ceph-dash with Content-Type: application/json! JSON is easily parsable in any programming language, so you can use the information from ceph-dash to automate processes with your own tools in your own infrastructure.
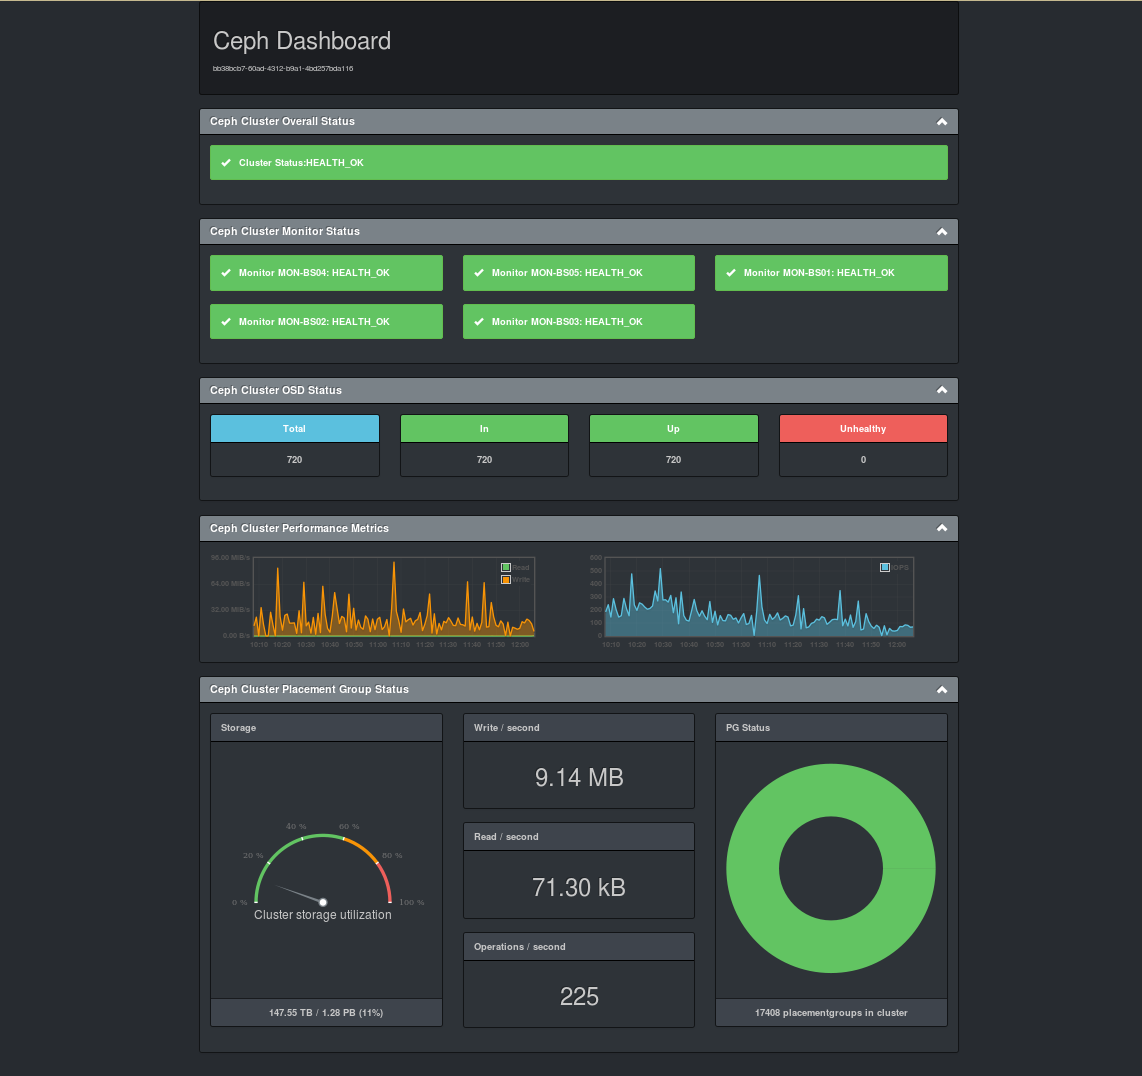
Ceph-dash uses the awesome D3 Librabry to display graphs for your Graphite data! Anything that you feed into graphite can be integrated into ceph-dash to complete the whole picture of your cluster health even more! We are using the Nagios-Check for ceph-dash to gather performance data, that we then show as graphs in ceph-dash!
I have also provided a Nagios/Icinga Plugin that uses ceph-dash as a monitoring endpoint. You can simply plug it into you monitoring coniguration and get the cluster status and lots of performance data from your cluster without the need of running local processes on your ceph systems! The check can be obtained here and an article about monitoring Ceph with ceph-dash can be found here.
Ceph-dash is a WSGI application, powered by Flask. That means you can deploy it into WSGI-capable webserver, like Apache or Nginx. Sample configuration files for these two webserver are already included into ceph-dash. Make use of it! Since the built-in webserver is single threaded and just for testing, this will improve performance a lot!